Visualisation
JobShopLab provides powerful visualization tools to help understand and analyze scheduling results. This tutorial covers the available visualization options and how to use them effectively.
Visualization Methods
JobShopLab supports three main visualization backends:
Dashboard: Interactive Gantt chart visualization using Dash
Debug CLI: Rich text-based visualization for debugging
Simulation: 3D visualization of the production environment
Basic Usage
To visualize scheduling results, use the render method:
# Create and run environment
env = JobShopLabEnv(config=config)

# Run simulation
done = False
while not done:
    action = env.action_space.sample()  # or your policy
    obs, reward, truncated, terminated, info = env.step(action)
    done = truncated or terminated

# Visualize results with default backend
env.render()

# Or specify a backend
env.render(mode="dashboard")  # Gantt chart
env.render(mode="debug")      # CLI table
env.render(mode="simulation") # 3D visualization
Configuring Visualization
Set the default visualization method in your config file:
env:
  render_backend: "render_in_dashboard"  # Default backend

render_backend:
  render_in_dashboard:
    port: 8050
    debug: False

  cli_table:
    loglevel: "warning"

  simulation:
    port: 8051
    bind_all: False
    json_dump_dir: "data/tmp/simulation_interface.json"
Gantt Chart Dashboard
The Gantt chart dashboard is the most comprehensive visualization tool:
# Show dashboard
env.render(mode="dashboard")
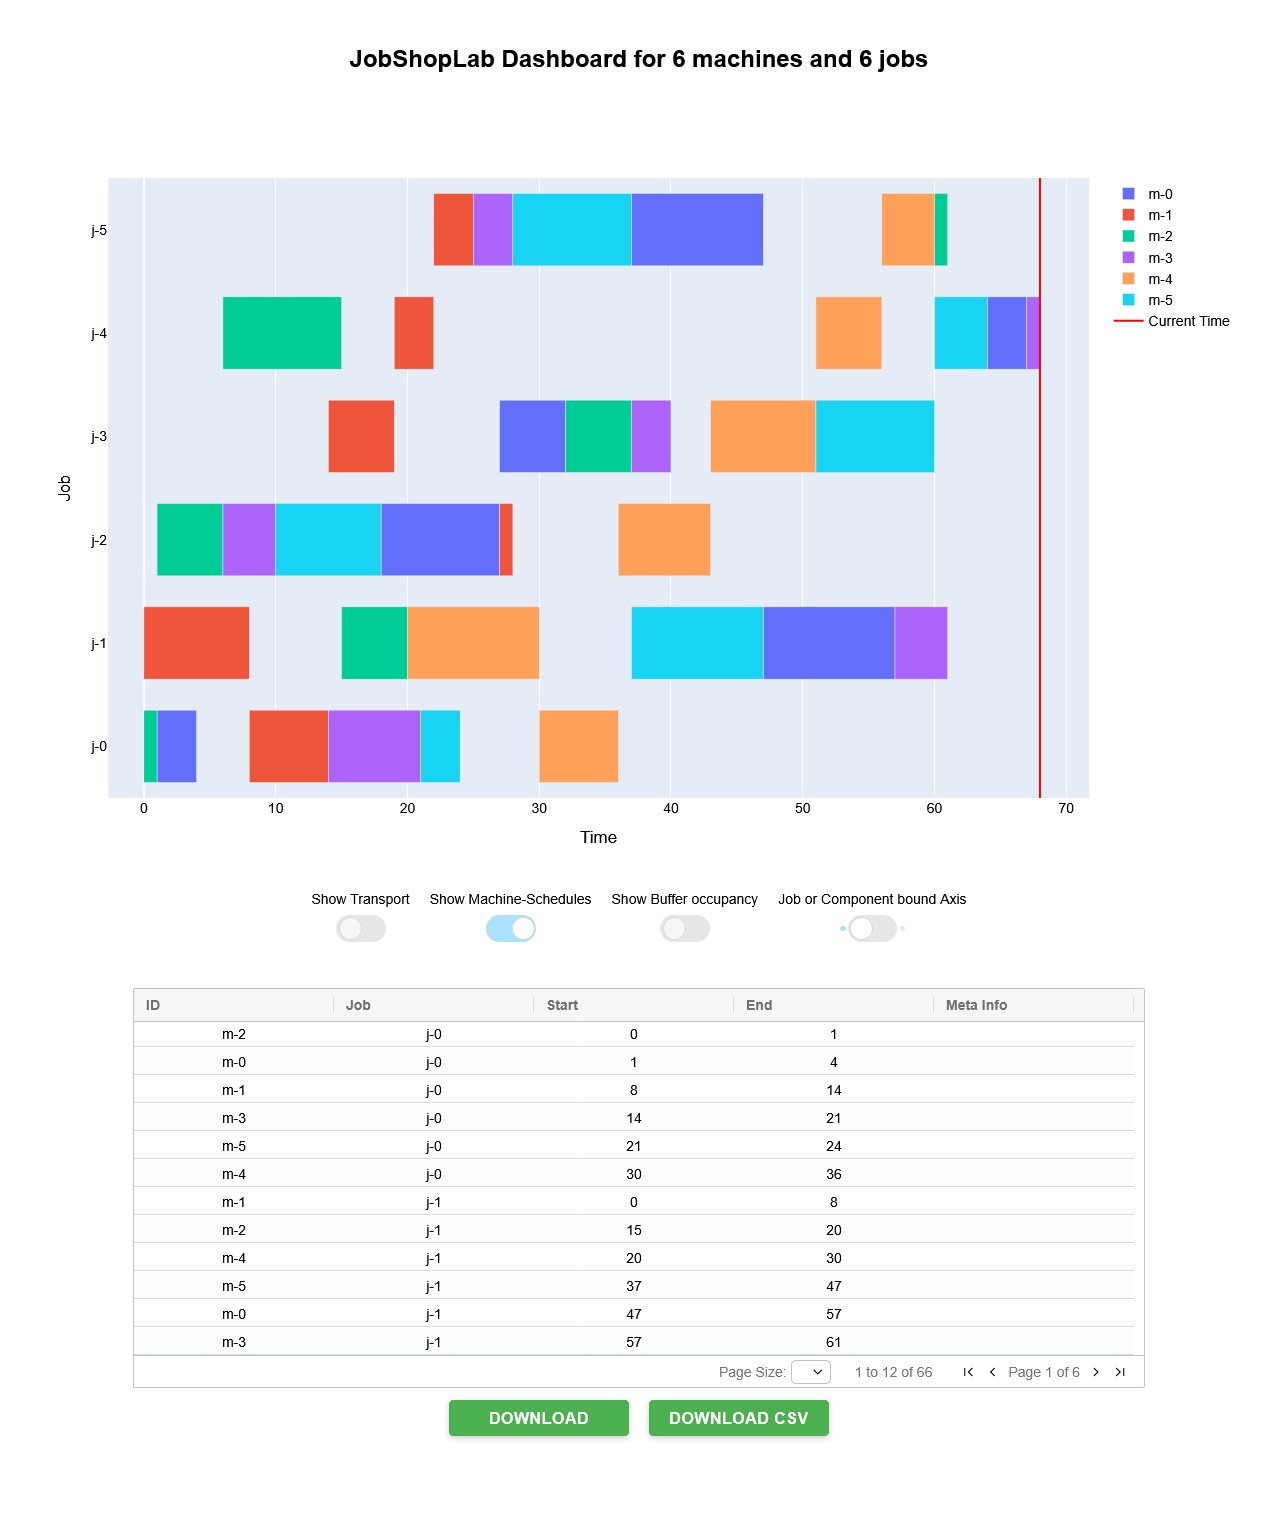
Example of the JobShopLab Gantt chart dashboard showing job schedules and machine utilization
Dashboard Features:
Interactive timeline of all operations
Color-coded jobs and machines
Zooming and panning
Detailed tooltips with operation information
Table view of job and machine status
When using the dashboard:
The dashboard runs as a web application on the specified port (default: 8050)
In Jupyter notebooks, it displays inline
Otherwise, it opens in your default web browser
CLI Debug Visualization
For quick debugging or when working in terminal environments:
# Show CLI table
env.render(mode="debug")
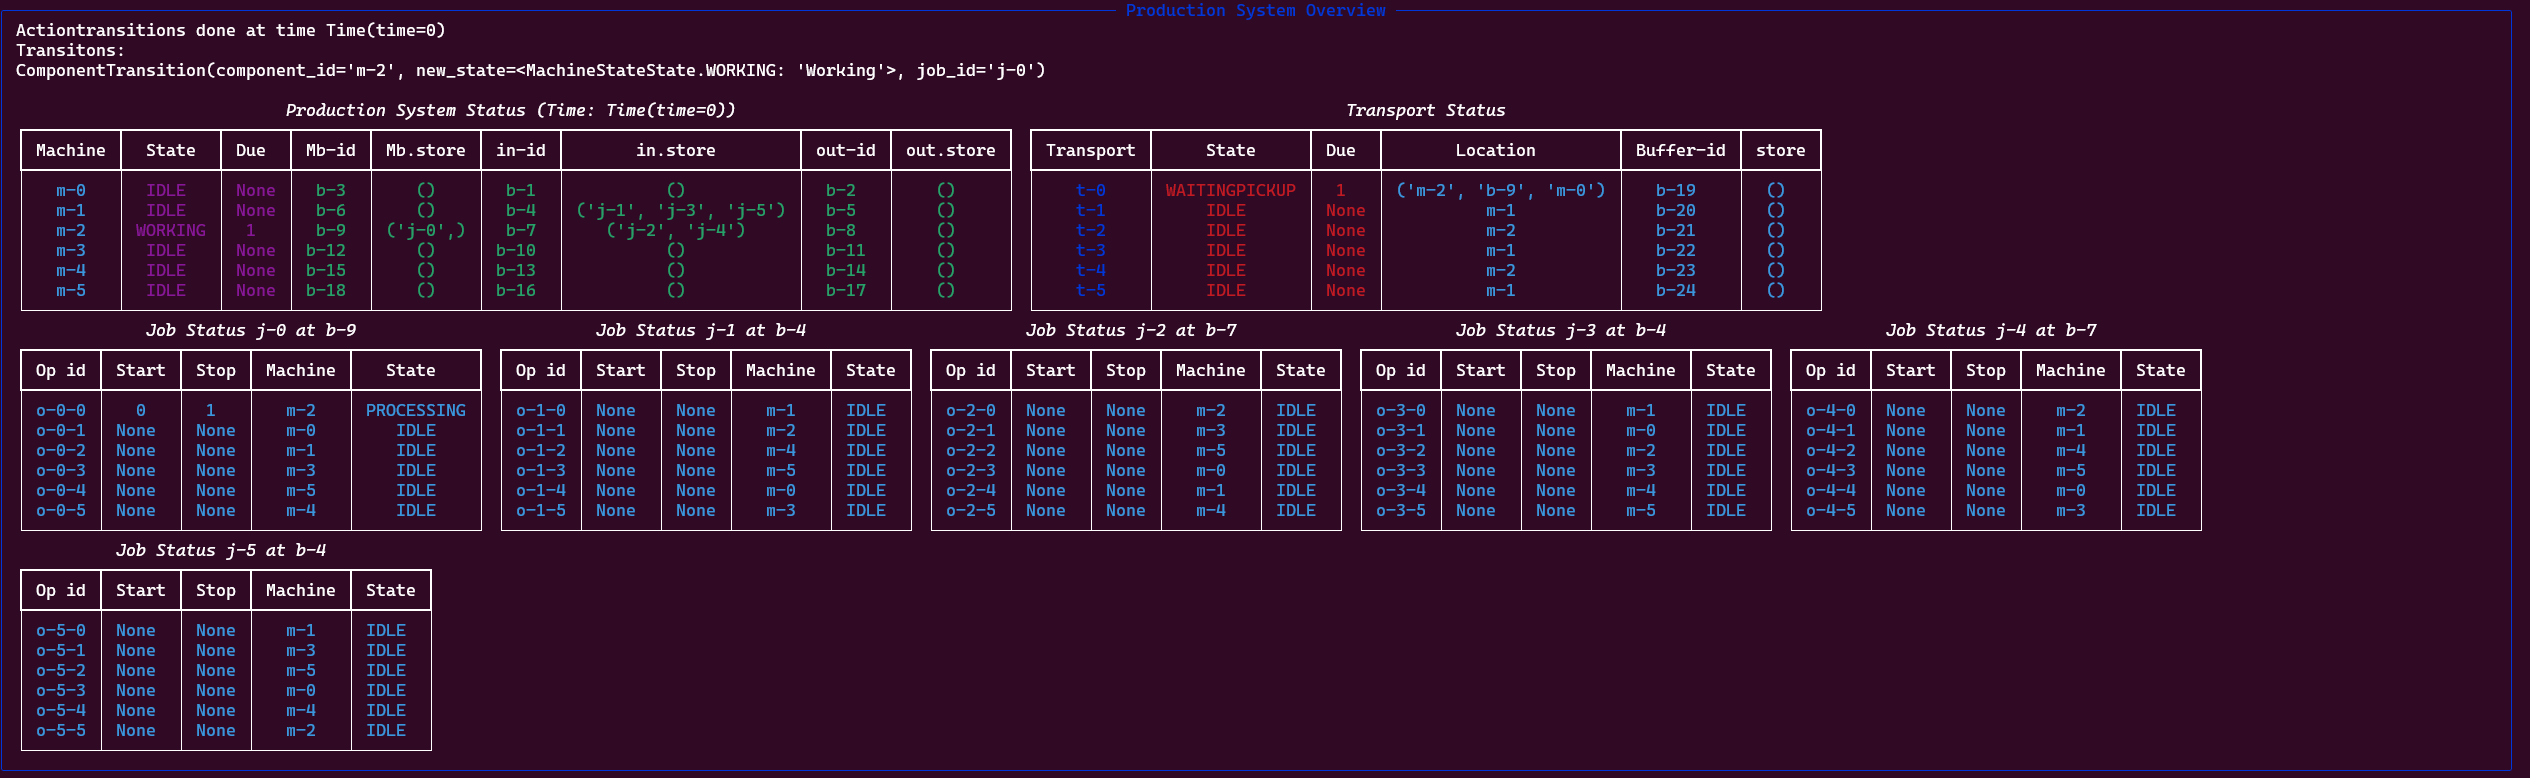
The CLI visualization provides:
A text-based representation of the schedule
Machine timelines with operation codes
Job completion status
Current system state
This mode is particularly useful for: - Debugging scheduling behavior - Working in remote or terminal-only environments - Quick checks during development
3D Simulation
For a more immersive visualization of the production environment:
# Show 3D simulation
env.render(mode="simulation")
The 3D simulation shows:
Physical layout of machines
Job movements between operations
Transport resources (AGVs, conveyors)
Buffers and queues
This visualization helps understand: - Spatial aspects of scheduling - Transport logistics - Resource contentions